Profile Page > All Flights > Tap on a flight recording
Tapping a flight recording in your flight log will open up the detail view for the flight recording. You will see a map of the flight path that you can move around and zoom in and out of. Under the map you will see some details about the flight.
The detail view screen is broken into tabs for your flights:
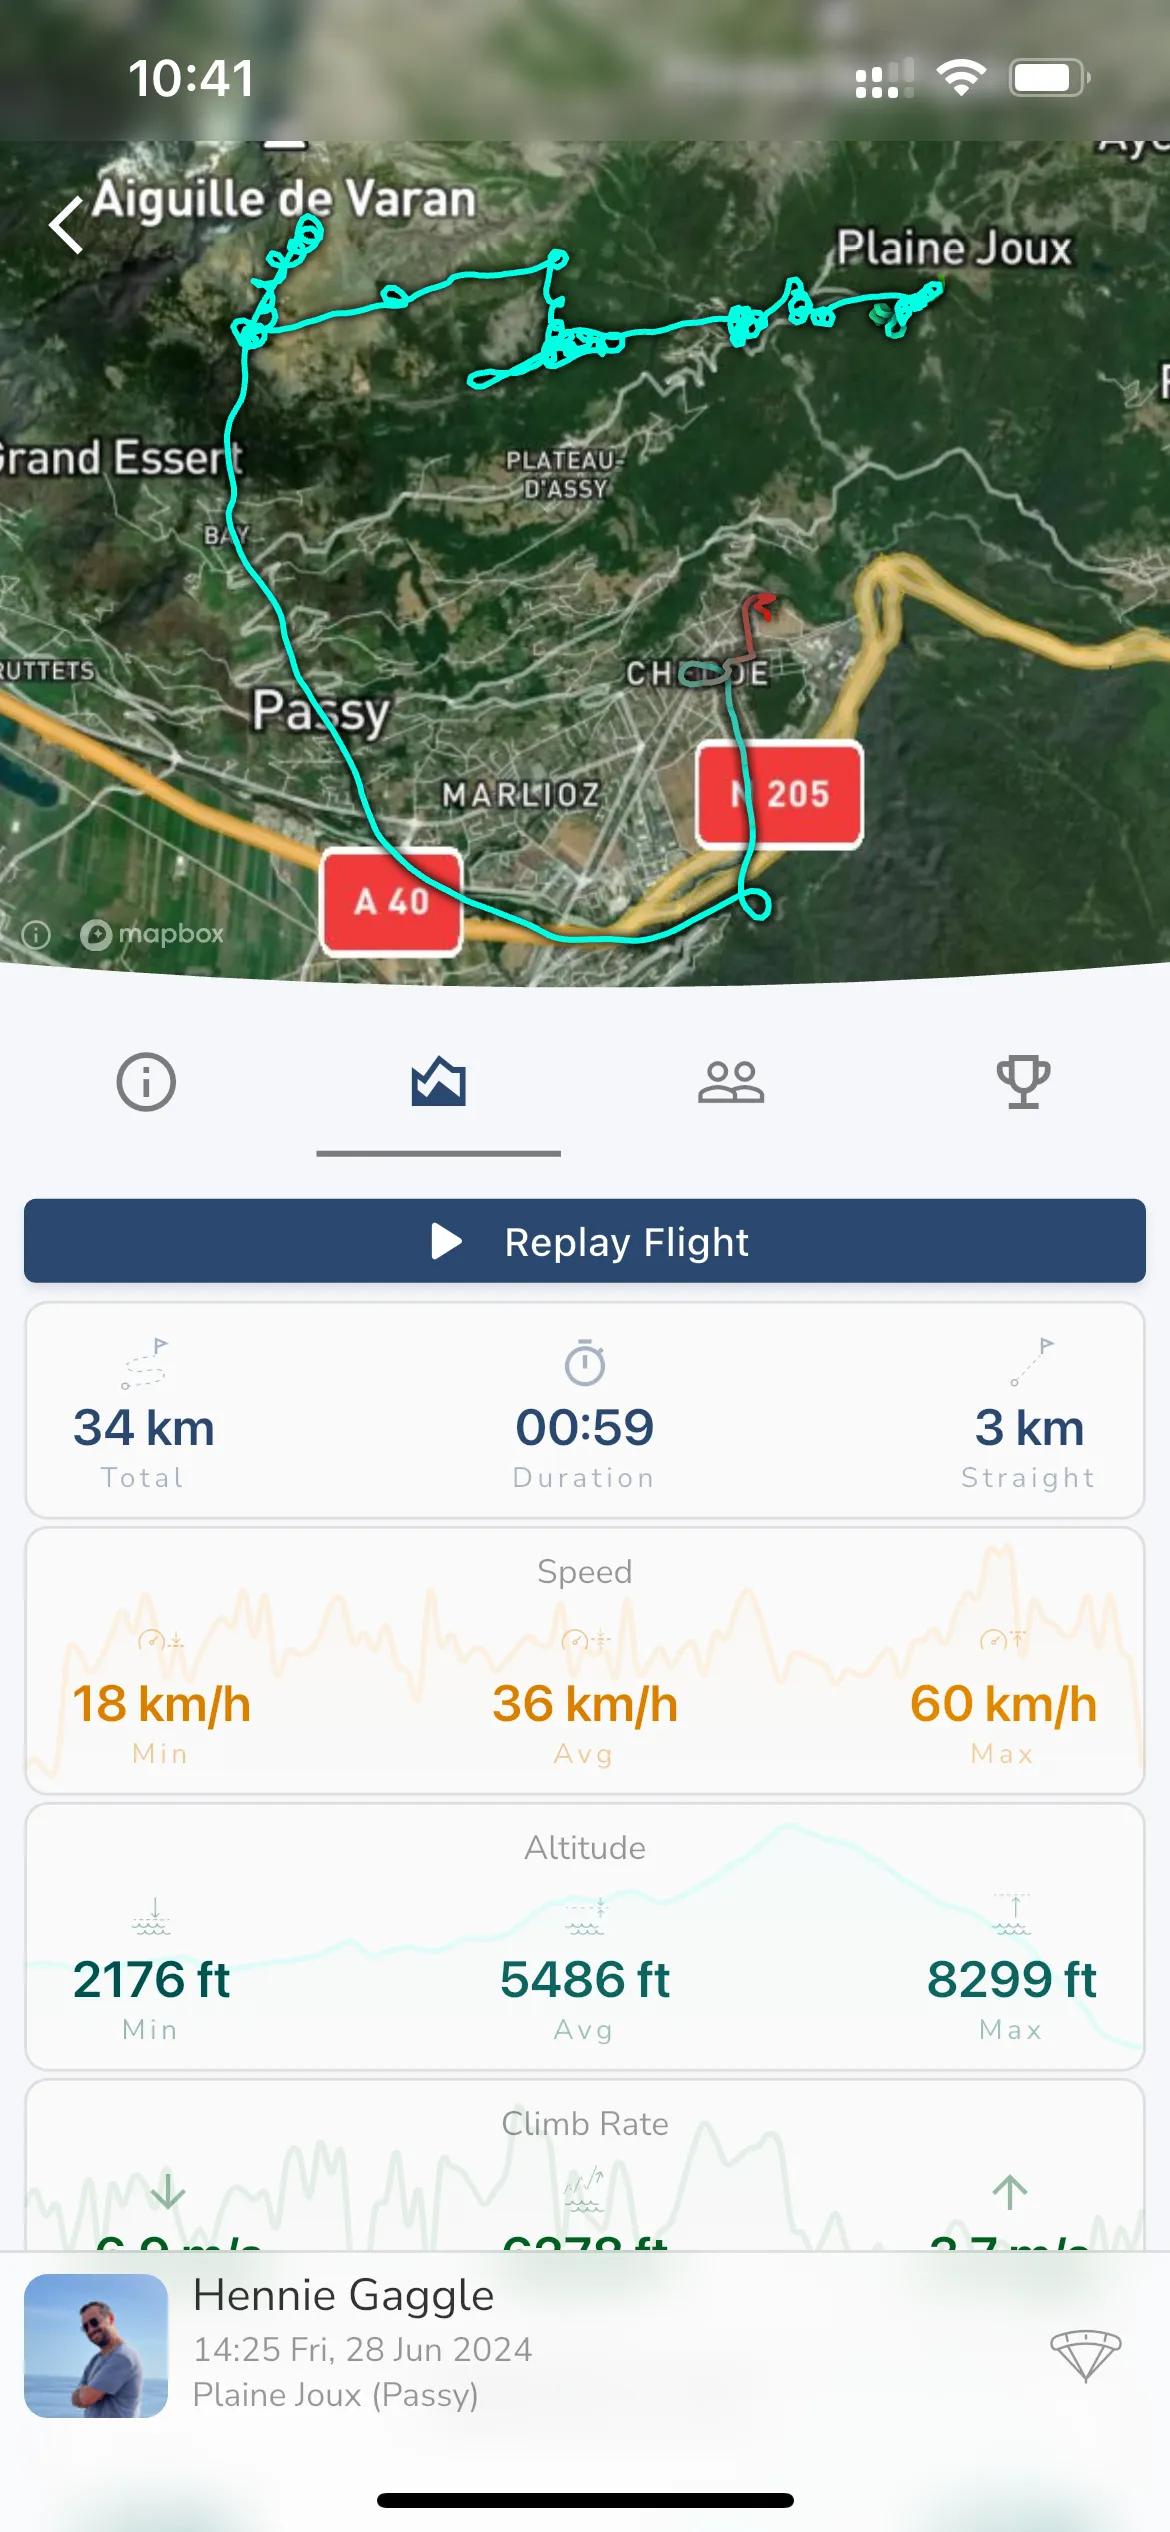
The flight analysis tab shows you details about your flights. The following details is shown (when available) for every flight:
Time and Distance - The total track length of the flight from start to end, the duration of the flight, and the distance from takeoff to landing.
Speed - The minimum, maximum, and average speed of the flight.
Altitude - The minimum, maximum, and average altitude of the flight.
Climb Rate - The max sink, max climb, and total altitude gained.
Height Above Ground - The maximum, and average height above ground.
G-Force - The maximum G-Force experienced during the flight.
For each of the graph items you can tap and hold on the graph to see the exact value for that point on the graph. This will also change the track on the map view to show you where you were at that point in the flight. The track will also change color to match the color of the graph item you are viewing, with darker colors being higher values and lighter colors being lower values.
From here you can also replay your flight using the Replay Flight button. This opens up the replay viewer that gives a full screen view of your flight in 2D or 3D. To replay flights recorded in other apps, simply import your IGC file into Gaggle and then replay the flight in full 3D.
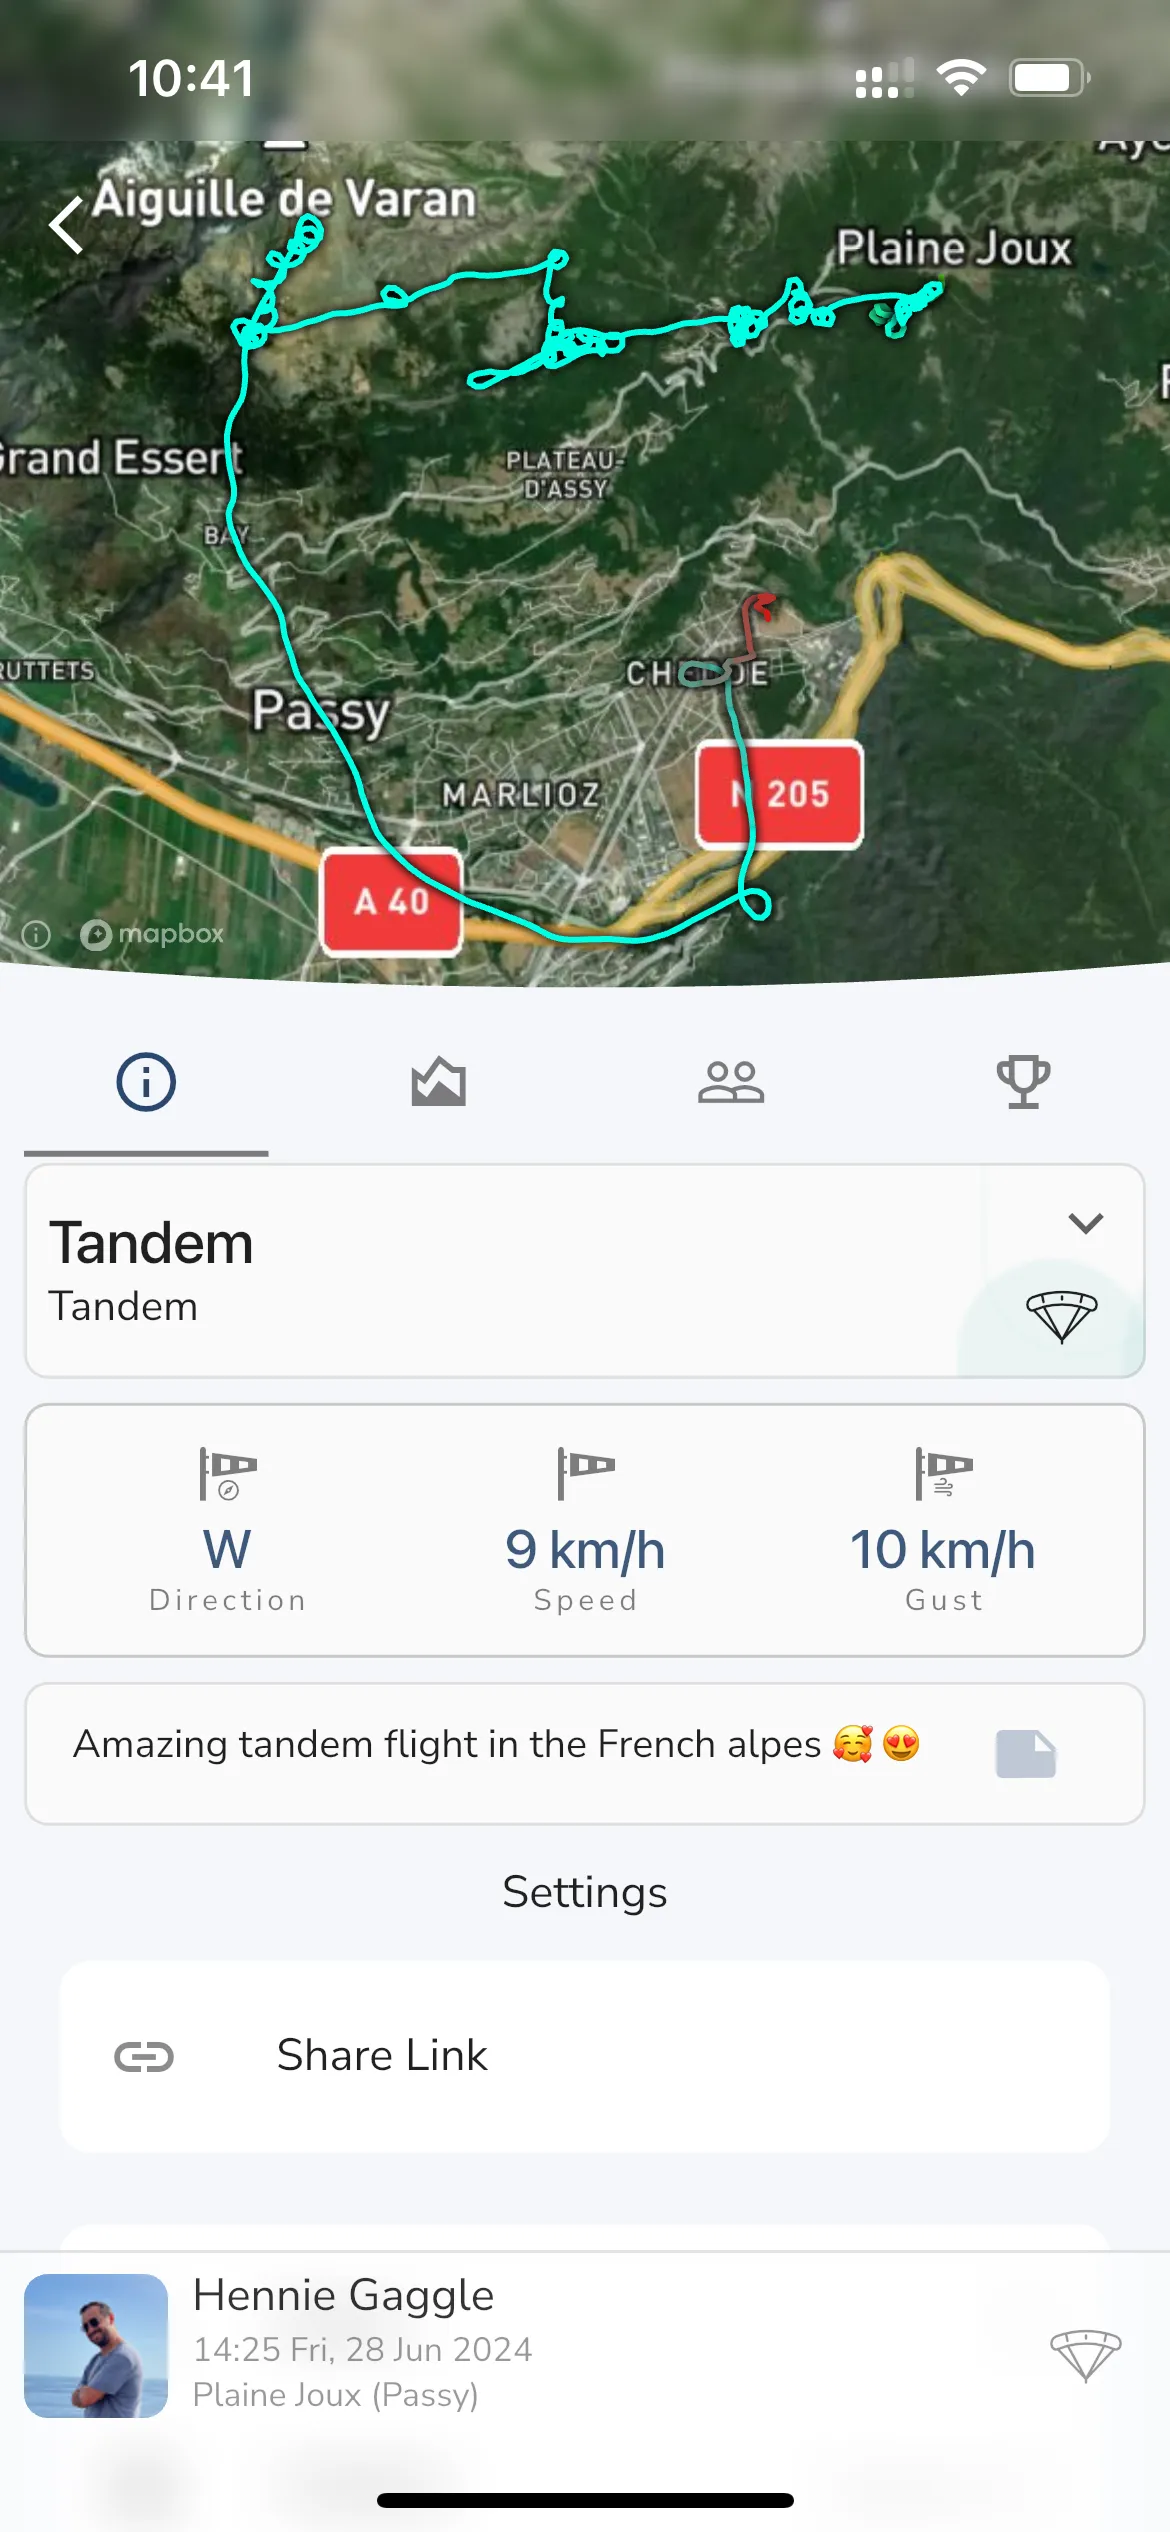
The general flight info tab shows you the following details about your flight:
Wing - The wing you flew with. You can tap this to change the wing if you flew with a different wing.
Motor - The motor you flew with. You can tap this to change the motor if you flew with a different motor.
Fuel - The final fuel level of your motor, fuel consumption per hour, and fuel used. You can tap this to change the fuel level if you know what it was.
Wind - The wind direction and speed at takeoff.
Notes - Any notes you want to add for the flight.
Other options available are:
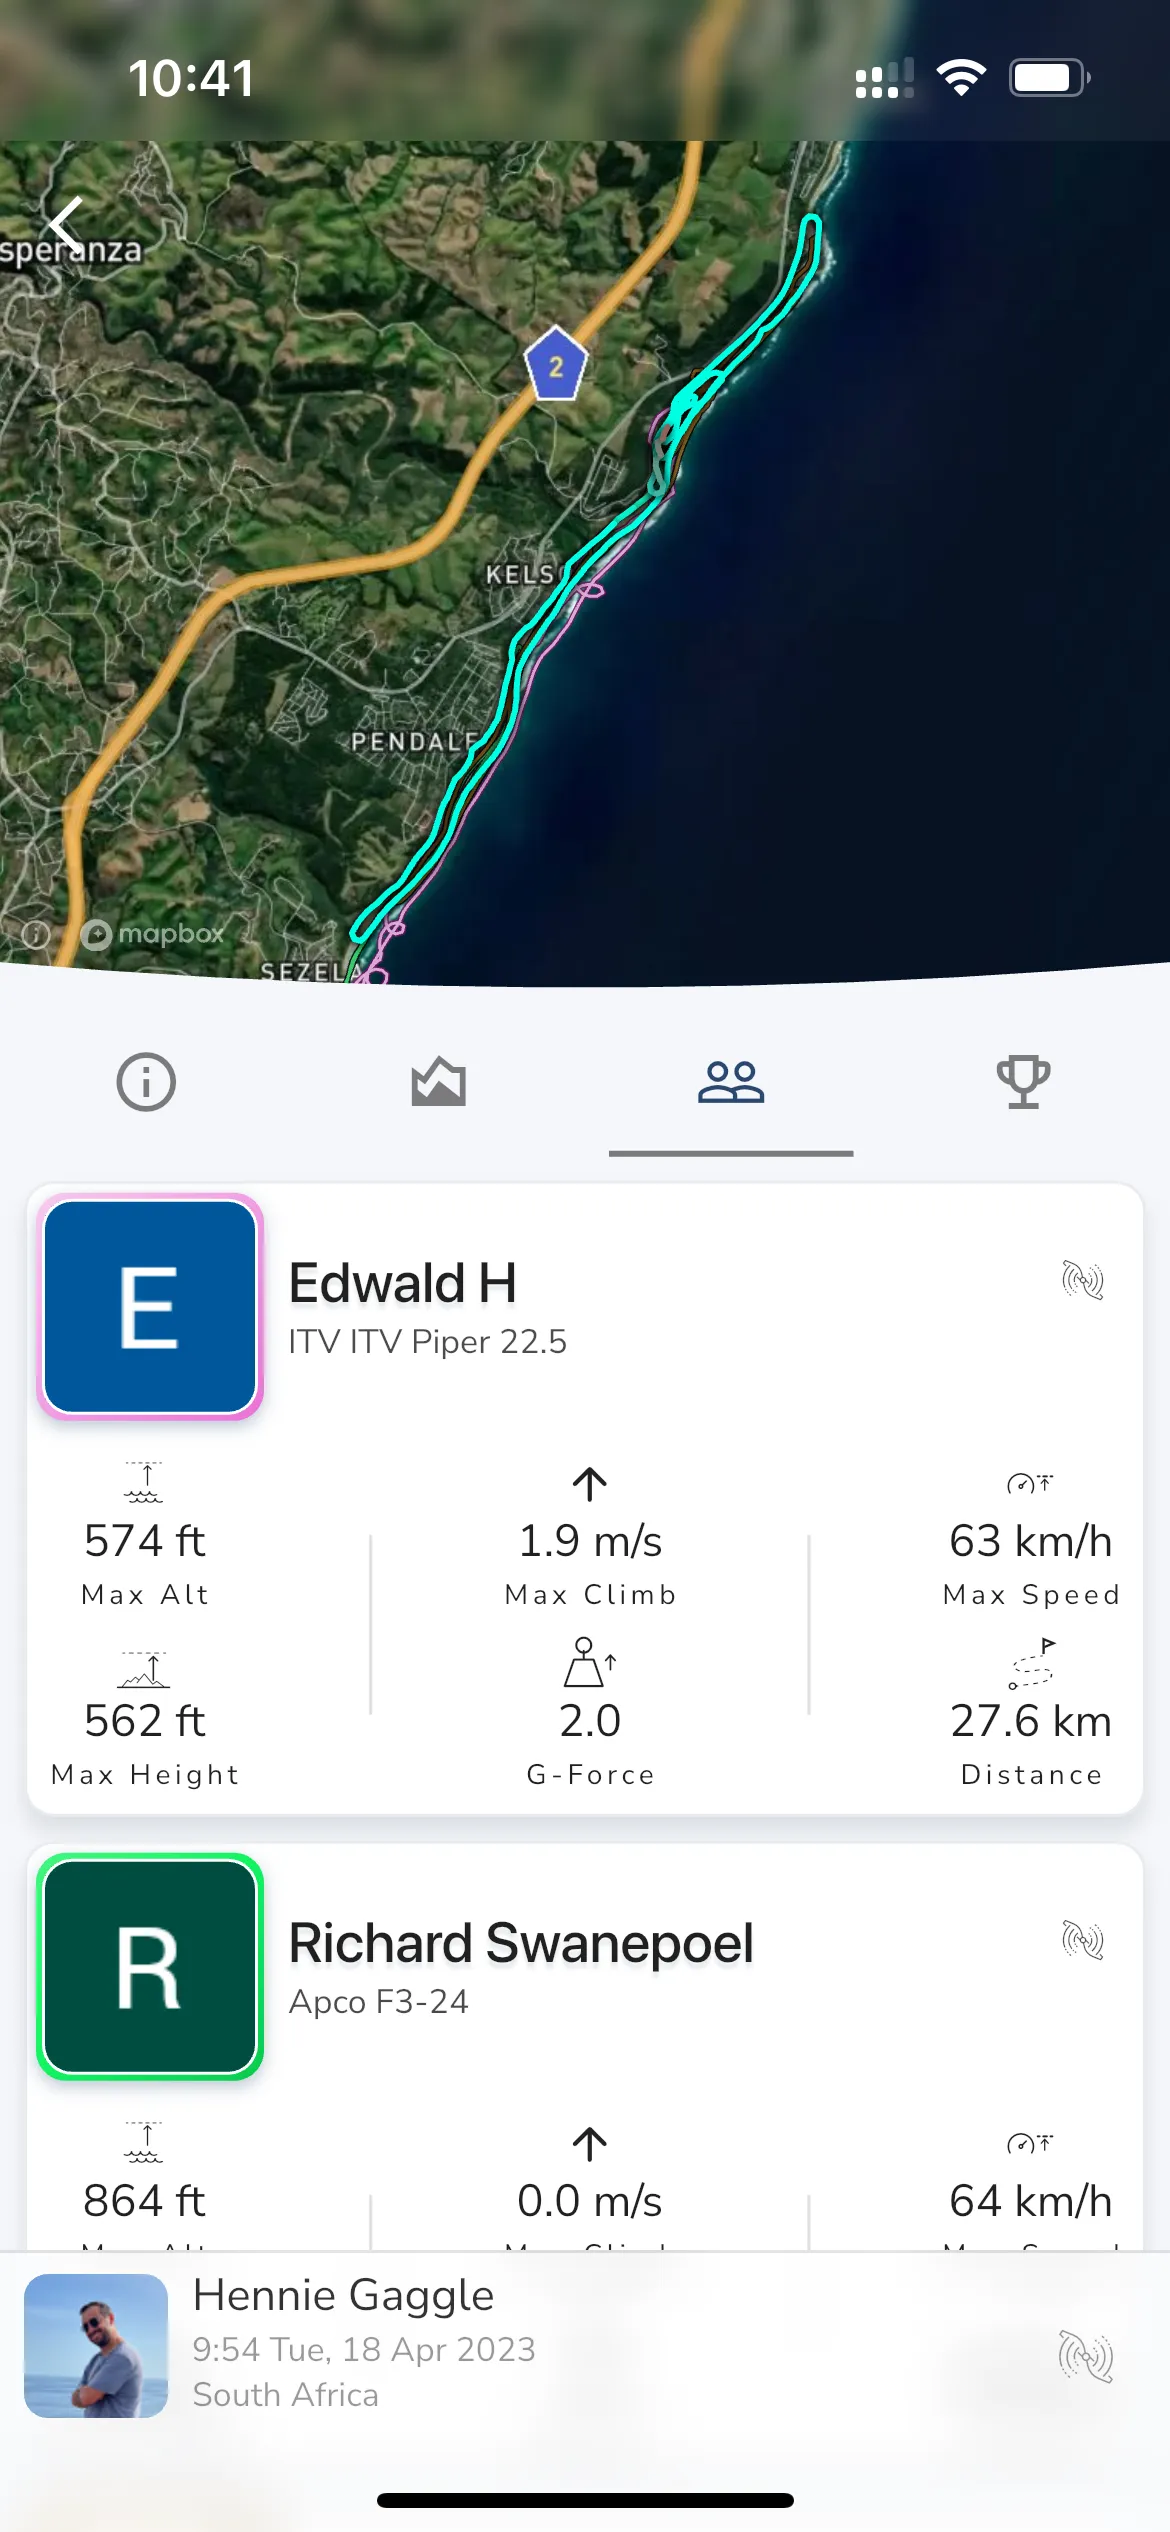
If you have flown with friends that belong to the same groups as you, then you will see their flights listed here. You will see a card with some basic details about every friends flight like the duration, max altitude, and distance. You can swipe on the card to hide their recording line on the map or to unlink their flight from yours.
If Gaggle did not automatically link the flight then you can link it manually by tapping the Link Recordings button and choosing the recording. If you cannot find the recording then it may not be on our servers yet or the recording has been set to private.
If you have leaderboards in any of your groups and your recording is shared with those groups then the leaderboard scores for this specific flight on each leaderboard will be shown here. Some leaderboards like the obstacle course allows you to tap the leaderboard to see the obstacle course on the map. Any active leaderboards will also show in the flight replay view.